Isotachs are used to show wind speed on a map. The isotachs on this map of Florida are measured in intervals of 10 knots.
http://weather.cod.edu/help/700tach.gif
Isotachs are used to show wind speed on a map. The isotachs on this map of Florida are measured in intervals of 10 knots. This is a map that makes the use of isobars. Each isobar represents the air pressure within the particular areas represented. http://www.newmediastudio.org/DataDiscovery/Hurr_ED_Center/Hurr_Structure_Energetics/Closed_Isobars/Closed_Isobars_fig02.jpg

 LIDAR or Light Detection and Ranging is technology that measures the properties of scattered light to find the range or other information about an object. The following picture is a LIDAR image of Mount St. Helens in Wasington State.

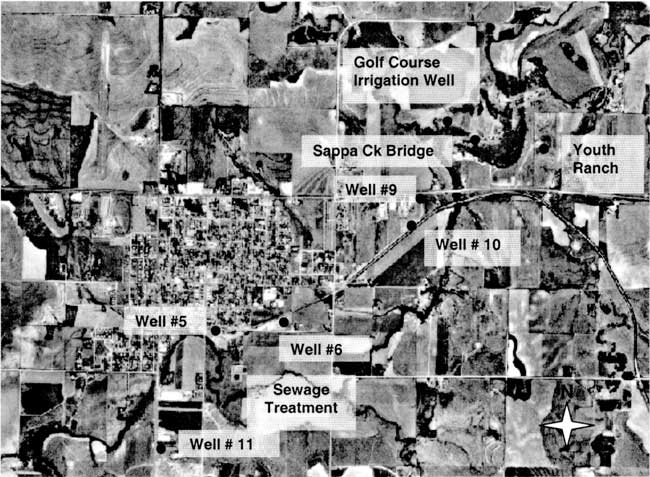
The Black and White Aerial Photograph is of Oberlin Kansas. The photo shows agricultural land use that surrounds the city. It also shows the location of water wells around the city.
http://www.kgs.ku.edu/Hydro/Publications/2001/OFR01_50/gifs/fig1.jpg
 The picture here is an aerial infared photograph of Lookout Mountain in Tennessee. The photograph shows how the different colors of the infared spectrum look.