 Correlation Matrix refers to the departure of two random variables from independence. There are several coefficients, measuring the degree of correlation, adapted to the nature of the data. The following illustration is a commodities correlation matrix.
Tuesday, December 2, 2008
Correlation Matrix
Correlation Matrix refers to the departure of two random variables from independence. There are several coefficients, measuring the degree of correlation, adapted to the nature of the data. The following illustration is a commodities correlation matrix.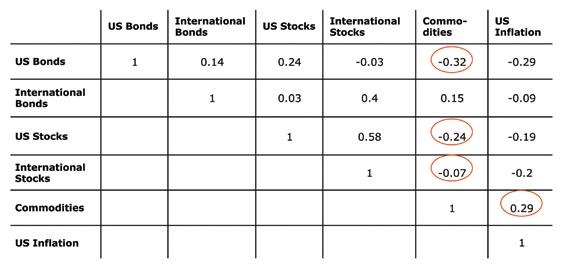
Similarity Matrix
 A similarity matrix is a matrix of scores which express the similarity between two data points. The following illustration is an amino acid similarity matrix.
http://mendel.ethz.ch:8080/Server/ServerBooklet/_17545_tabular891.gif
Star Plots
 The star plot is a graphical method of displaying multivariate data. Each star represents a single observation. Star plots are generated in a multi-plot format with many stars on each page and each star representing one observation. Star plots are used to examine the relative values for a single data point and to locate similar points or dissimilar points.
Stem and Leaf Plot
 A stem-and-leaf plot is a display that organizes data to show its shape and distribution. The ones digit and the tens digit and greater of each data item is separated as leaves and stems respectively.
Box Plot

A box plot is a way of graphically depicting groups of numerical data. The box plot shown here shows the fuel economy averages by different country.
Histogram
 A histogram is a graphical display of tabulated frequencies, shown as bars. It shows what proportion of cases fall into each of several categories. The following histogram is of final exam scores and how many students fell into each score range.
Parallel Coordinate Graph
 Parallel coordinate maps are a visual multidimensional coordinate system with applications in the air traffics control, data mining and models of complex systems.
Subscribe to:
Comments (Atom)