skip to main | skip to sidebar

My Map Catalog

Tuesday, December 2, 2008

Correlation Matrix

Correlation Matrix refers to the departure of two random variables from independence. There are several coefficients, measuring the degree of correlation, adapted to the nature of the data. The following illustration is a commodities correlation matrix.
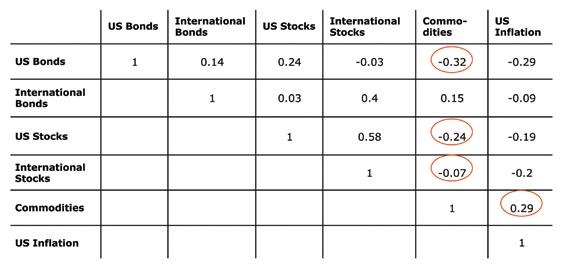
http://www.japaninc.com/files/images/mgz_72_commo-Decorrelation.JPG
Posted by Parker at 11:28 AM

No comments:

Post a Comment

Older Post Home
Subscribe to: Post Comments (Atom)

Blog Archive

  • ▼  2008 (54)
    • ▼  December (31)
      • Correlation Matrix
      • Similarity Matrix
      • Star Plots
      • Stem and Leaf Plot
      • Box Plot
      • Histogram
      • Parallel Coordinate Graph
      • Triangular Plot
      • Windrose
      • Climograph
      • Population Profle
      • Scatterplot
      • Index Value Plot
      • Lorenz Curve
      • Bilateral Graph
      • Nominal Area Choropleth Map
      • Unstandardized Choropleth Maps
      • Standardized Choropleth Map
      • Univariate Choropleth Map
      • Bivariate Choropleth Map
      • Unclassed Choropleth Map
      • Classed Choropleth Map
      • Range Graded Proportional Circle Map
      • Continuously Variable Proportional Circle Map
      • DOQQ
      • DEM
      • DLG
      • DRG
      • Isopleth
      • Isopach
      • Isohyets
    • ►  November (2)
    • ►  October (16)
    • ►  September (5)

About Me

Parker
View my complete profile