skip to main | skip to sidebar

My Map Catalog

Tuesday, December 2, 2008

Index Value Plot

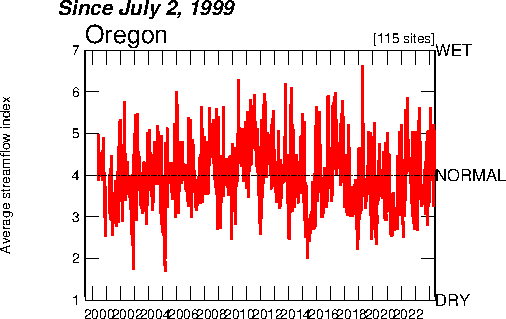
The following index value plot shows the rainfall recorded in inches in Oregon from 1999 until 2006. Four inches of rain fall per years is considered normal and is the base number. Anything above or below four inches is a variance.
http://water.usgs.gov/waterwatch/regplots/real/real_or_2.gif
Posted by Parker at 9:57 AM

No comments:

Post a Comment

Newer Post Older Post Home
Subscribe to: Post Comments (Atom)

Blog Archive

  • ▼  2008 (54)
    • ▼  December (31)
      • Correlation Matrix
      • Similarity Matrix
      • Star Plots
      • Stem and Leaf Plot
      • Box Plot
      • Histogram
      • Parallel Coordinate Graph
      • Triangular Plot
      • Windrose
      • Climograph
      • Population Profle
      • Scatterplot
      • Index Value Plot
      • Lorenz Curve
      • Bilateral Graph
      • Nominal Area Choropleth Map
      • Unstandardized Choropleth Maps
      • Standardized Choropleth Map
      • Univariate Choropleth Map
      • Bivariate Choropleth Map
      • Unclassed Choropleth Map
      • Classed Choropleth Map
      • Range Graded Proportional Circle Map
      • Continuously Variable Proportional Circle Map
      • DOQQ
      • DEM
      • DLG
      • DRG
      • Isopleth
      • Isopach
      • Isohyets
    • ►  November (2)
    • ►  October (16)
    • ►  September (5)

About Me

Parker
View my complete profile